Dwelling price divergence emerging as Australia reopens at a varying pace
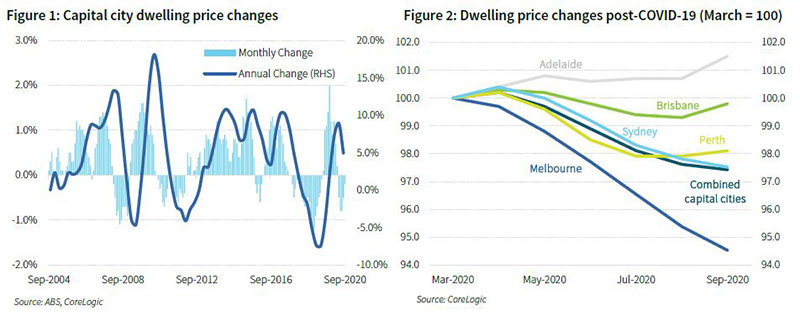
Australian house prices fell for a fifth month in September (see Figure 1), as declines in Sydney and Melbourne outweighed recoveries in the smaller markets in the rest of the country (see Figure 2). Unsurprisingly, cities where the virus has been well contained and economic activity is less restricted (particularly around the movement of people) are faring better.
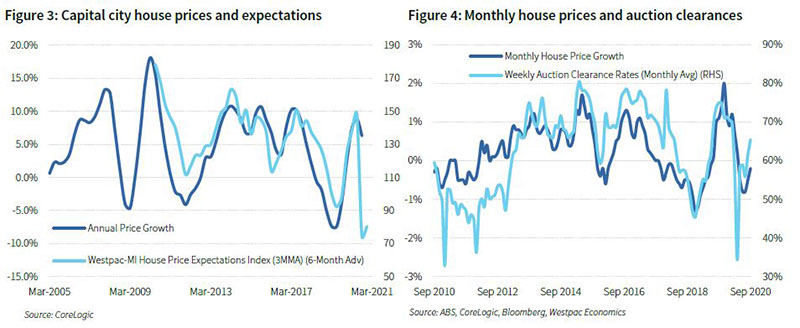
House price expectations have also found a floor (see Figure 3). This follows signs of improvement in housing market activity in recent months, as restrictions on movement that were in place earlier to contain the COVID-19 outbreak ease across much of the country. Auction clearance rates also point to a stabilisation in prices in the near-term (see Figure 4), although the figures clearly do not reflect the uncertain state in Victoria, which has been effectively frozen out of consideration (for completeness, volumes outside of Victoria are not too dissimilar to those twelve months ago). As Victoria gradually emerges from lockdown (presumably), signs of increased market activity should similarly emerge, although we expect downward pressure on prices to persist for the remainder of the year. To the extent we avoid further restrictions, both in Victoria and more broadly, it then becomes a question of whether record low interest rates--which appear to be having the desired effect thus far--will be sufficient to offset an absence in population growth (amongst at least two other emerging impediments).

Mortgage activity responding to monetary policy, with further policy responses likely
If we concentrate solely on residential property, it is clear that changes in the cost of credit are having the desired effect--borrowing costs are falling and demand for new loans is picking up. Recall the RBA delivered two key policy initiatives at the onset of the pandemic (both covered here in further detail):
- Lowering short-term rates through the use of yield curve control. Having lowered the cash rate to 0.25% in March, the RBA announced that it will also purchase government securities (across the yield curve) in an effort to target a yield on 3-year Australian Government bonds of around 0.25%; and
- Providing funding support to lower bank borrowing costs and support lending. The RBA also announced the initial provision of at least AUD90bn in three-year funding for banks at 0.25% (referred to as the Term Funding Facility [TFF]), in return for eligible collateral, with further funding available if directed toward small and large business customers. This has since grown to around AUD150bn, with the RBA recently agreeing to increase the size of the TFF to AUD200bn and allow drawing of funds up until June 2021.
As we suggested at the time, targeting the shorter-end of the yield curve made sense within the Australian context as most borrowing is carried out at the shorter end of the curve--generally less than five years. Borrowers are also overwhelmingly on variable or short-dated fixed (generally three years or less). Unsurprisingly, demand for fixed-rate mortgages has been particularly strong. The TFF funding is considerably cheaper than wholesale funding of similar maturity--the ability to draw on the TFF has contributed to overall bank funding costs falling by around 60 basis points since February (source: RBA). Lending rates have accordingly fallen, most notably for owner occupiers (three-year fixed is down more than 70 basis points since February, compared with a decline in the cash rate of 50bps) and small business (more than 100bps). Variable rates arguably have further to fall too, which will add further stimulus to credit demand.
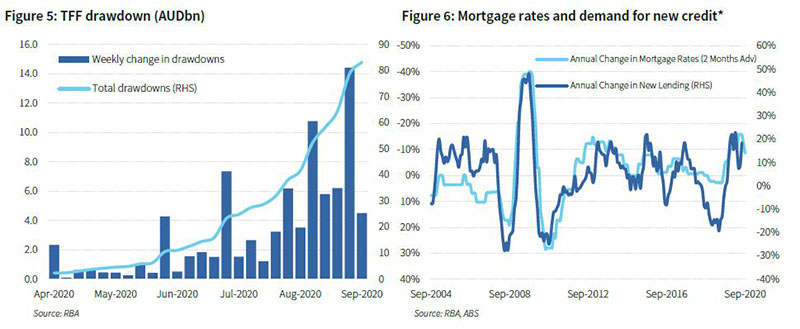
Figure 6 shows the relationship between changes in lending rates and demand for new lending. Recall that one of the primary purposes of easing monetary conditions is to bring demand forward. All else equal, lower interest rates will increase the demand for credit and, for at least the last 15 years, property prices (see Figure 7). Serviceability has subsequently improved considerably, not only for new borrowers, but also existing borrowers (see Figure 8 for refinance levels). Broadly speaking, housing, as a risk asset, should respond no differently to other risk assets such as equities--all else equal, lower interest rates increase their attractiveness relative to other lower-yielding assets (household savings hit a record of 19.8% in the June quarter--invariably, some of this cash sitting on the sidelines--including in excess of AUD50bn typically spent on overseas travel by Australians each year--will find its way into higher yielding assets, such as property).
The response from investors has been less pronounced to date, however (again, see Figure 7). The short-term outlook for investors is less than ideal, with the collapse in inward migration and a substantial rise in underutilisation (unemployed and underemployed) amongst our younger cohorts most likely to be felt in terms of capital city rentals--particularly in Sydney and Melbourne (explored further below).
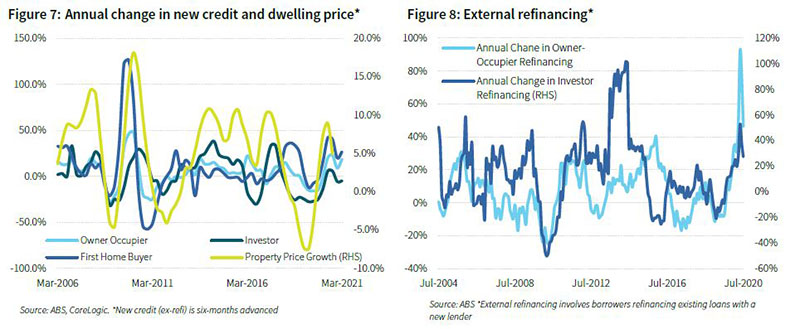
Further policy responses should be expected. The Federal Treasurer has flagged plans to repeal responsible lending obligations, opting for a principles-based approach (i.e., ensuring lenders continue to comply with APRA’s lending standards) rather than a prescriptive approach. In effect, this would replace the current practice of ‘lender beware’ with a ‘borrower responsibility’ principle. The change follows observations made by the RBA, which may or may not be related (draw your own conclusions), that the “pendulum may have swung a bit too far” (on tightening of lending standards). As the availability of credit is made easier, volumes should increase, although the quantum is not overly clear--lenders in the past have observed challenges with turnaround, not necessarily higher decline rates. However, it is also reasonable to conclude that an emphasis on ‘borrower responsibility’ will probably diminish the degree of scrutiny around living expenses, in particular, which could be a precursor to increased borrowing capacity. Recall changes to serviceability assessments in July 2019 year contributed to a considerable increase in credit demand (and price growth) (see Figure 7 and 8).
It also appears the RBA is not yet content to sit on its hands given the outlook for inflation and employment is not consistent with its objectives over the period ahead, which may pave the way for further stimulus. We also wouldn’t rule out a further extension of the TFF given its success to date.
Loan repayment deferrals start to unwind as borrowers assess their options
The easing in availability and cost of credit contrasts with at least three existing and emerging impediments. The first is the unwind of loan repayment deferrals (see Figure 9), the majority of which were set to expire in September and October.
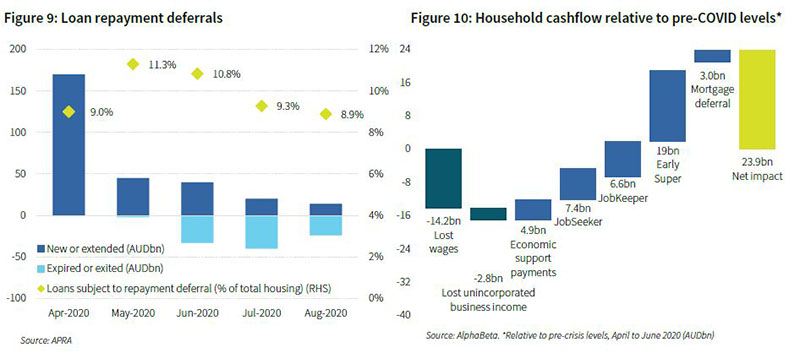
The gain to household disposable income from mortgage repayment holidays is relatively small compared with other support measures (JobKeeper in particular has increased substantially since) (see Figure 10). Loan deferral arrangements provide some insight into serviceability pressures but are unlikely to be an indicator of imminent mortgage default. The broader concern however is that the expiration of repayment deferrals was initially scheduled to coincide with the unwinding of other fiscal support (JobKeeper and the JobSeeker), as well as the expiry of early access to super (although we were never overly enamoured with that policy). UBS estimates ~AUD50bn in (cumulative) fiscal support (cash handouts, super withdrawals, and loan deferrals) in September will fall to ~AUD8bn from October.
APRA has since announced an extension of its temporary capital treatment for bank loans with repayment deferrals to cover a maximum period of 10 months from the start of a repayment deferral, or until 31 March 2021, whichever comes first. About 20% of borrowers are making full or partial repayments, which suggests the proportion of loans under repayment deferrals should decline noticeably when their initial deferral term expires (although there will be a prolonged unwind given the high likelihood borrowers in Victoria will seek an extension, which account for between 25% and 30% of loans under deferral arrangements). In-light of very low borrowing (interest) costs, where appropriate, we would expect a reasonably high proportion of borrowers to transition onto interest-only repayments (particularly those currently making partial repayments).
An element of rightsizing is likely to still take place as restrictions on movement are eased and the country returns to a degree of normality. As various income support arrangements are unwound, it is highly probable some jobs will simply not return. Some sectors will struggle to recover until unrestricted travel resumes. Nine of the top ten regions for mortgage deferrals are in Queensland tourist destinations, according to credit reporting agency Equifax. Loss of income is a key cause of mortgage default. The likely rise in forced or distressed sales over the next six months for borrowers who have lost their jobs may still weigh on prices.
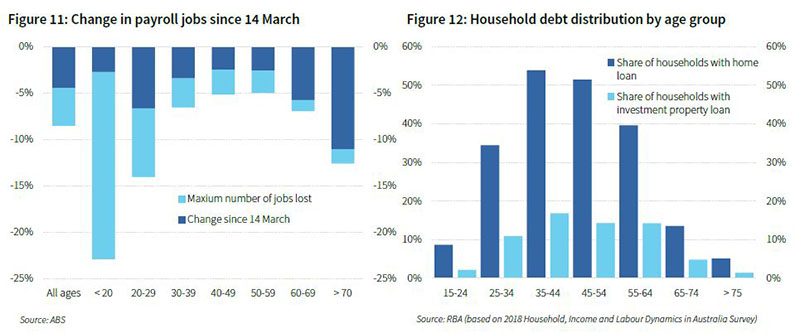
Overwhelmingly thus far, the impact to employment has been most acutely felt at opposing ends of the age spectrum (amongst our younger and more mature cohorts) (see Figure 11), both of whom account for relatively low levels of household debt (see Figure 12).
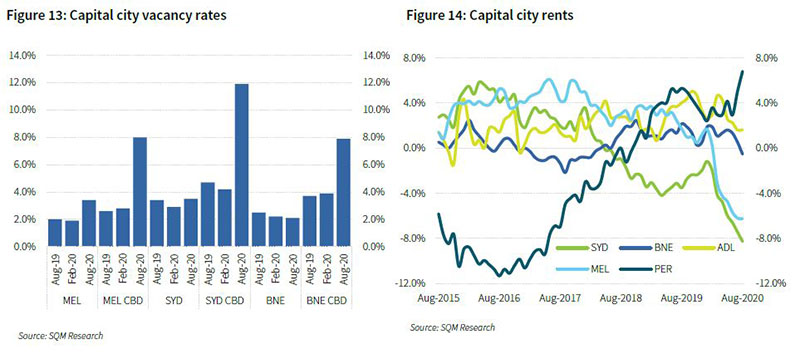
The significance of rising job losses amongst younger individuals, along with a collapse in migration, foreshadow consequences for the demand for rental properties. Vacancy rates have risen sharply in recent months, particularly in inner-city markets (see Figure x), which, when coupled with rental relief arrangements (in Victoria) and increasing supply still coming onto market (esp. in Melbourne and Sydney), is putting downwards pressure on rents. This is likely to further weigh on investor demand and may cause problems for heavily geared property investors (although we note that higher-risk loans, such as investor, interest-only, and high loan-to-valuation, are not disproportionately represented in repayment deferral arrangements).
With unemployment forecast to rise for the remainder of this year, pressure on prices is likely to persist. The outlook for heavily geared property investors looks particularly soft. Property prices declines (from the recent peak earlier in the year) of up to 10% still appear highly probable in areas, particularly greater Melbourne and tourism/student-dependent cities. However, with considerable monetary and fiscal policy aimed toward making credit cheaper and more accessible, the potential for a sharper than previously anticipated rebound in dwelling prices is increasing. At the very least, we would suggest country-wide price declines would peak at less than 10%, which would largely unwind price gains over the last 12 months.
Focus on higher-rated, prime RMBS issues
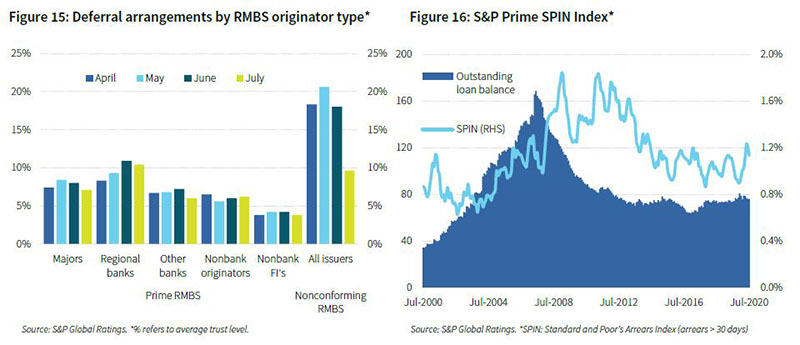
Because most lenders are not including loans under COVID-19 hardship arrangements (see Figure 15), RMBS arrears are yet to reflect the underlying level of repayment performance (see Figure 16). Nevertheless, payment deferrals in-effect act no differently to arrears insofar as they reflect a decline in cash inflows in the RMBS warehouse, which reduces income available to meet interest payments. Like prices, arrears will vary by state in line with their different paths to economic recovery, but arrears will rise as forbearance starts to unwind. Losses are likely to emerge in 2021. According to rating agency S&P Global Ratings (S&P), exposure to central business districts across Australian RMBS is limited to less than 2% of total loans outstanding. This suggests the soft outlook for inner-city investment properties should only have a modest impact on RMBS performance.
Prepayment rates have increased in response to strong refinancing activity in the second quarter of 2020 (see Figure 17). Although refinance activity appears to have peaked (see Figure 8), the recent decision from the Federal government to ease accessibility to credit may see prepayment rates revert above longer-term averages as lenders compete to a refreshed baseline for underwriting.
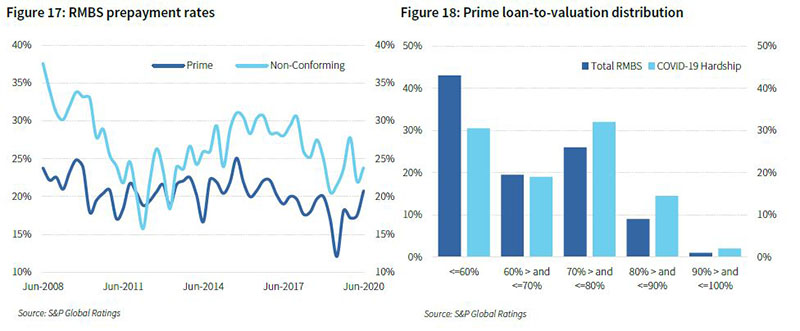
We remain comfortable with Prime RMBS, despite the confluence of contrasting forces outlined above. Given the preceding period of strong prices over recent years, the weighted average loan-to-valuation amongst Prime RMBS issuance currently sits at just over 60%, while the average seasoning is just over five years. The high level of seasoning and accumulation of credit support as loans are repaid translates into a level of excess hard credit support above minimum rating requirements. Although hardship applications (mortgage deferrals) are disproportionality higher for mortgages with a loan to valuation ratio above 70% (see Figure 18), they compare favourably to non-conforming mortgages (see Figure 19). Cash reserves (or liquidity facilities) also provide good support against mortgage repayment deferrals.
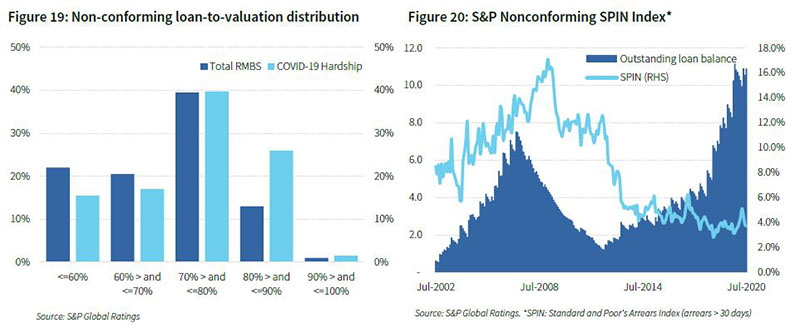
We would remain quite selective about non-conforming issuance at this stage and, in any event, would remain in the higher rated tranches. According to S&P, half of the loans under COVID-19 arrangements in the nonconforming sector are less than 24 months’ seasoned, reflecting the generally lower seasoning profile of this sector. The sector has experienced substantial growth as one of the beneficiaries of restrictions imposed on commercial banks in 2017 and 2018, and as such, have yet to fully season (which generally takes place over a medium-term period [~five years plus]) (see Figure 20).
The nonconforming sector has a higher exposure to self-employed borrowers which comprise around 50% of total loan exposures in trusts (according to S&P). SME’s have been hardest hit by the pandemic, and with the unwind of income support underway, they will be heavily reliant on local economies reopening. Nonconforming transactions also have a greater reliance on excess spread for additional credit support than prime RMBS transactions; excess spread is likely to be constrained by mortgage deferrals and then a subsequent rise in arrears. Despite this, according to S&P, Australian nonconforming transactions (rated by S&P) have liquidity reserves or facilities that would cover an average of around 11 months of senior expenses and note coupons for rated notes at current interest rates, even if cash inflows to the transaction fell to zero--a scenario that nevertheless remains unlikely.