In Australia a credit rating has been determined to be a “wholesale” financial product which means that retail clients are not allowed to be shown credit ratings in relation to a particular product or for the purpose of procuring a sale. This article provides general credit rating information and is provided solely for educational purposes.
Credit ratings are an indication of perceived risk. Each year Standard and Poor’s Global (S&P) release a global report that shows defaults as well as rating movements (upgrades and downgrades).
The most recent Global Corporate Default Study and Rating Transitions report covers the 2025 year and reviews the agency’s actions taken worldwide including rating upgrades and downgrades. They also publish a weekly summary of defaults so we can get the most up to date information (as at 18 June 2026).
So far in 2026, there have been 45 defaults globally. Comparing to the most recent high default years of 2020 (COVID), 2016 (oil crisis) and 2009 (GFC), at this point in the year there had been 151, 135 and 234 defaults respectively. Of these 45 corporates that defaulted, none were Australian.
In 2009, distressed exchanges (where bondholders are offered a deal to exchange their bonds for new ones, usually at a price and new coupon lower than at issue of the original bond, which S&P Global counts as a default due to bond holders accepting terms less favourable than when the bonds were issued) were the highest reason for default, closely followed by missed payments.
However, in 2020 missed payments outstripped exchanges by 1.5x, although since then exchanges have been by far the largest default type. This implies that the speed of a stress environment arising allows less time for flexibility in managing debt arrangements, and the faster this is, the trickier for issuers.
Global defaults rates – Investment grade versus speculative grade
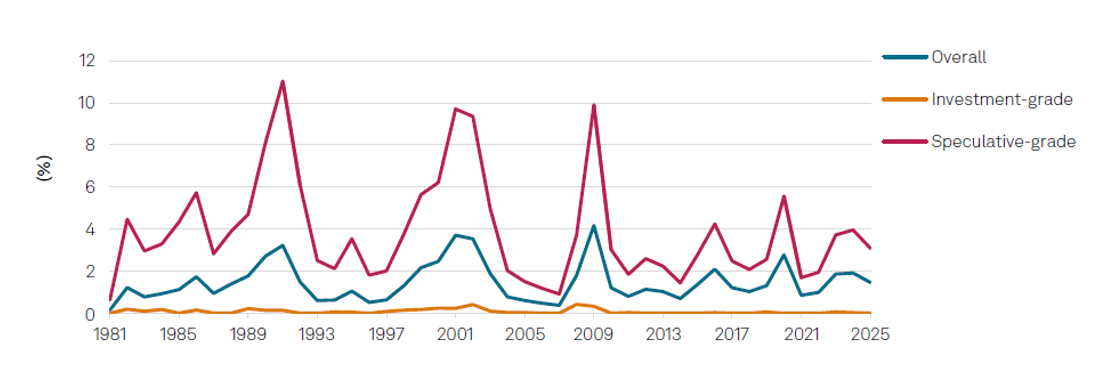
Figure 1. The graph depicts the global corporate default percentages for investment grade, speculative grade and overall from 1981 – 2025.
Source: S&P Global Ratings Credit Research & Insights, S&P Global Market Intelligence's CreditPro.
This approximate 10-year cycle, which coincides with global or large-scale recessions, highlights the need for portfolio asset diversification. Each of these default peaks corresponded to significant drops in equity prices. While the peak was 268 rated defaults in 2009, global investment grade defaults peaked at 14 in 2008 – from a sample of over 3,000. For investors looking to protect their capital, investing in investment grade bonds is shown to be a statistically safe way to diversify holdings and recession proof investments.
In terms of where we got to in the 2020 COVID default period, defaults reached only about half of those seen in ‘natural’ recessions, rather than the self-induced artificial circumstances of that episode, no doubt mitigating the expected numbers due to the extreme measures taken by governments that have not been fully wound back and has largely led to the current inflationary environment we now find ourselves in.
Investment grade stacks up over the life of the study
The statistics over the ~45 year study period should give confidence to investors in highly rated bonds. The table below shows the probability of default given the term to maturity. For example, an A- rated bond has a historical incidence of default over five years of 0.41% (2019 0.68%). This increases for the lowest investment grade credit rating of BBB- to 2.31% (2019 3.44%).
In 2025, there were no investment grade rated issuer defaults, although one defaulted issuer had been rated investment grade the year before its default.
It’s important to note that a default means the company failed to meet its interest or principal obligations by the due date and does not mean the investor lost money – see a definition at the end of the note.
Global S&P cumulative default rates
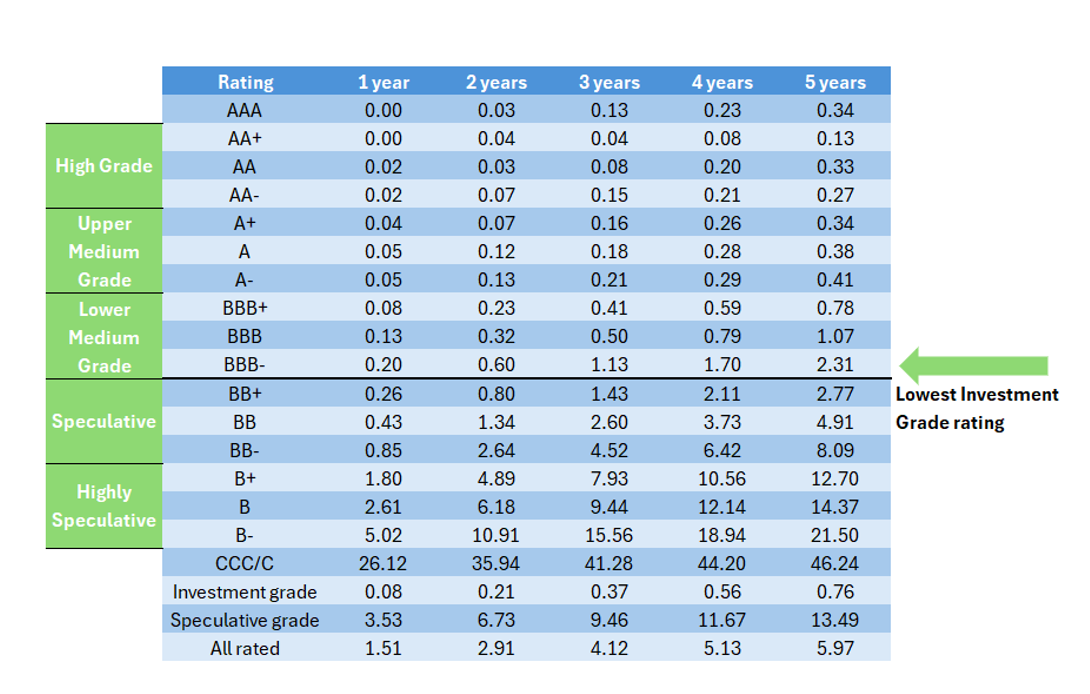
Figure 2. The table shows the historical percentage incidence of default for AAA rated to C including average default rates of investment grade, speculative grade and all rated bonds. Data from S&P’s 2025 annual global corporate default study and rating transitions report
Source: FIIG Securities, Standard and Poor’s
The majority of defaults for 2025 were, as usual, recorded in the US, being 60% of the total, reflecting its large bond market which is the most mature of bond markets globally. The US also has the largest number of speculative grade issuers at 53% of the global total. As most defaults tend to come from speculative grade issuers, the concentration of defaults among U.S. issuers is not surprising.
An Australian default?
Historically, the Australian default statistics are lower than the global statistics, in part due to our almost exclusively investment grade market, but also due to our concentration towards stronger, larger financial institutions.
What constitutes a default?
For the purpose of the S&P Global study, a default is recorded on the first occurrence of a payment default on any financial obligation that is rated or unrated – other than when subject to a bona fide commercial dispute. An exception is when an interest payment is missed on the due date but is made within the contracted grace period. Preferred stock is not considered a financial obligation; a missed preferred stock dividend is not normally equated with default. Distressed exchanges are considered a default; that is when bond holders are coerced into accepting substitute instruments with lower coupons, longer maturities, or any other diminished financial terms.
S&P Global deem ‘D’ (default); ‘SD’ (selective default); and ‘R’ (under regulatory supervision) as defaults for the purpose of the study.
Loss given default
As mentioned above, it is important to distinguish between a default, which can be for many reasons (some of which are discussed above), and the loss that may eventuate as a result of that default, which is termed ‘loss given default”.
AxsessToday, an unrated issuer, defaulted in late 2018. They had issued a number of secured bonds in the Over-the-Counter (OTC) market as well as an unsecured listed retail bond on the ASX.
Investors in the secured bonds received 100% of their capital back but the unsecured bondholders received only about 34% of their capital.
Therefore, from the same event of default, different investors had different loss outcomes depending on whether their bonds were secured or not.
This is an example of how capital structure is one of the many other determinants of risk in investing on bonds. We have focused in this article on ratings as there is an excellent data set which allows historical comparisons, but investors should be aware that ratings alone cannot quantify the risk of a bond investment, although they provide a good and relatively simple place to start.